Fixing Slow Engineering Teams — An Extended Field Guide for Founders
TL;DR — Series A companies often stall out after product‑market fit: deadlines slip, vendor hand‑offs pile up, and technical debt snowballs. In 60 days you can reverse those trends with five proven moves: cross‑functional squads, Shape Up cycles, Kanban flow, TDD, and automated CI/CD. This guide breaks down the “why” and “how,” bolstered by real metrics, third‑party studies, and a week‑by‑week rollout map.
Quick wins: Most pilots move from monthly releases to daily automated deploys in under eight weeks, slice defect rates nearly in half, and reclaim multiple developer‑months per quarter — all without adding headcount.
Table of Contents #
- Why Teams Slow Down After Seed Funding
- Common Pitfalls & Vendor Headaches
- JetThoughts Playbook — The 5 Core Moves
- 60‑Day Timeline & KPI Targets
- Objections—And the Data That Answers Them
- Mini‑Case: Fintech Startup in Freefall
- Cost–Benefit Snapshot
- Executive Summary
- Glossary for Busy Execs
- Next Step
Why Teams Slow Down After Seed Funding #
During the MVP phase, hero culture and quick hacks work fine. Post‑funding, the same tactics collapse under scale:
- Backlog sprawl. Hundreds of vaguely defined tickets accumulate. No one knows which matter.
- Time‑zone‑driven bottlenecks. A vendor‑run DevOps team on the other side of the world deploys at 3 a.m. your local time.
- Bug whack‑a‑mole. Every emergency patch introduces two new issues because there are no tests.
- Scheduling gridlock. Daily stand‑ups balloon to 60 minutes. Key contributors attend more meetings than coding hours.
Org‑Design Debt vs Tech‑Debt Technical debt is visible in code; org‑design debt hides in calendars, hand‑offs, and unowned outcomes. The latter usually drives the former.
Early red‑flag metrics:
| Metric | Healthy | Warning | Critical |
|---|---|---|---|
| Deploy frequency | Daily | Weekly | Monthly+ |
| Cycle time (start→prod) | ≤ 5 days | 6–10 days | 10 + days |
| Defect‑to‑feature ratio | < 0.25 | 0.25–0.4 | 0.4+ |
| Meeting hrs per dev / wk | < 6 | 6–10 | 10 + |
If two metrics sit in the “critical” column, it’s time for radical focus.
Common Pitfalls & Vendor Headaches #

| Symptom | Direct Friction | Long‑Term Damage | Hidden Cost |
|---|---|---|---|
| Separate web / API / mobile teams | 3–5 slack threads per small change | Fragmented ownership slows hiring | Multiple frameworks to maintain |
| Massive backlog | Engineers cherry‑pick → scope chaos | Morale melts, attrition risk rises | 8–12 hrs/wk backlog grooming |
| Vendor‑owned DevOps | Build failures resolved via ticket queues | Security blind spots, slow MTTR* | Escalation fees + hard lock‑in |
| No automated tests | Release = code freeze + manual QA sprint | Tech debt compounds exponentially | 40–50 % dev capacity on hot‑fixes |
| Meeting overload | 0.5 day of context switch per dev | Burnout, innovation grind to halt | Lost maker time & opportunity cost |
*MTTR = Mean Time To Recover
Research primers: • IBM System Science Institute — found defect‑fix cost multiplies 4 × at each later stage (unit → integration → production). • Google’s DORA 2024 survey — best‑in‑class deploy risk is ⅛ that of low performers while deploying 973× more often.
JetThoughts Playbook — The 5 Core Moves #
Below you’ll find an expanded dive into each move, plus checklists for immediate execution.
3.1 Cross‑Functional Value‑Stream Squads #
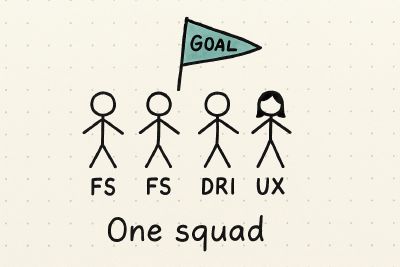
Why it works: Conway’s Law becomes a lever, not a liability. When one team owns “Checkout Flow,” its code naturally coalesces. Less API drift, fewer sync meetings.
Checklist to launch a pilot squad
- Define a single measurable outcome (e.g. “increase demo‑to‑paid conversion 15 %”).
- Assemble 3–5 contributors. Mix Fullstack T-Shape developers, designer, plus a product‑minded lead.
- Give them runway. Shield from other projects for one full Shape Up cycle.
- Set public metrics. Cycle time, throughput, and target KPI live on a dashboard.
- Rotate observers. Let skeptics shadow stand‑ups to witness smoother flow.
Pro tip: Use a “team canvas” workshop on day 1: articulate mission, rituals, and working agreements in two hours.
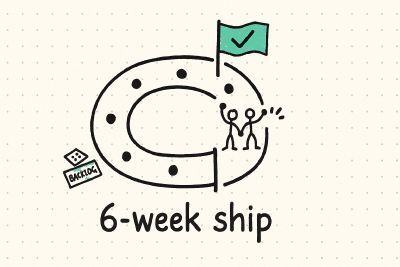
3.2 Shape Up 6‑Week Cycles #
Shape Up in 90 seconds
- Pitch: one‑pager that defines the problem, appetite (max time), rabbit‑holes, and solution sketch.
- Betting table: stakeholders allocate capacity to 2–3 pitches.
- 6‑week build: team delivers “must‑haves,” negotiates “nice‑to‑haves.”
- Cooldown (2 weeks): bug fixes, retrospective, next shaping.
Benefits
- Eliminates backlog grooming overhead.
- Sets hard boundaries, closing “never‑ending project” loops.
- Couples leadership strategy to delivery rhythm.
Anti‑patterns to avoid
- Turning pitches into spec docs.
- Adding work mid‑cycle (“scope bleed”).
- Skipping cool‑down — debt piles fast.
3.3 Kanban Flow & WIP Limits #
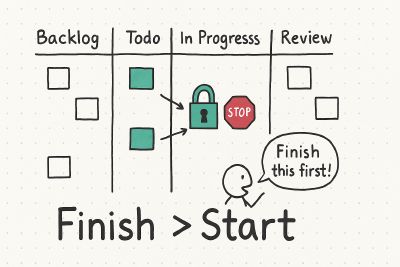
Most teams intuitively know “start less, finish more,” yet resist strict limits. Data convinces:
- Little’s Law — Lead Time = WIP ÷ Throughput. Reduce WIP, lead time falls.
- 2019 DevExec Survey — Teams lowering WIP from 6 to 3 tickets cut cycle time 47 % on average.
Starter board template
| Column | WIP Cap | Exit Criteria |
|---|---|---|
| Todo | ∞ | Groomed, acceptance criteria clear |
| In Dev | Dev × 1 | Code in PR, tests written |
| Review | Dev × 1 | All checks pass, 2 reviewers OK |
| Staging | 3 | Feature flags toggled off by default |
| Done | — | Deployed to prod, metrics tracked |
Continuous flow ritual: When Review hits its cap, the team swarms reviews before anyone starts new code. No exceptions.
3.4 Test‑Driven Development & Tiny PRs #
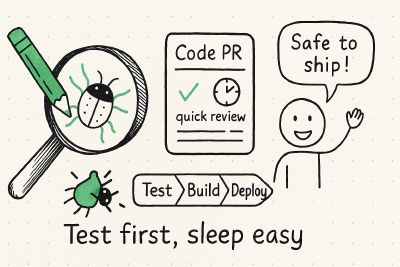
Why TDD in 2025? When paired with modern CI, TDD is the cheapest insurance policy:
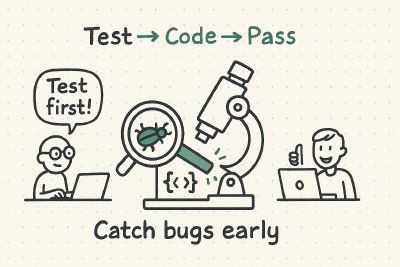
- Defects found in unit test cost ~$17 on average; in production, > $1,000 (IEEE “Cost of Quality” 2023 update).
- Teams practicing TDD report 15 % fewer critical incidents per quarter (GitHub Octoverse analytics).
Tiny PRs multiply that benefit:
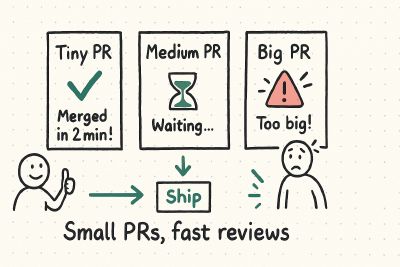
- Review time ↓ 70 % when PR < 300 LOC (CMU empirical study).
- Merge conflicts near‑zero, enabling trunk‑based flow.
Migration pattern for legacy code
- Wrap public APIs with tests first (golden master).
- Extract seams, refactor internals safely.
- Gradually raise coverage threshold in CI.
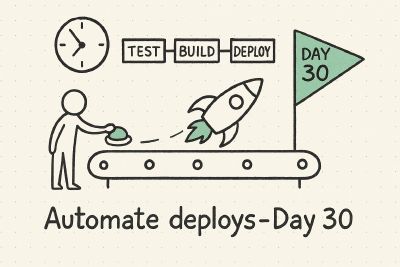
3.5 CI/CD by Day 30 #
Automation is the keystone that locks improvements in place.
Four levels of pipeline maturity
| Level | Trigger | Tests | Deploy Target | Rollback |
|---|---|---|---|---|
| L1 | Manual | None/manual QA | Prod monthly | Manual hot‑fix |
| L2 | Push | Unit | Staging daily | Scripted revert |
| L3 | Merge to main | Unit + integration | Prod daily | One‑click rollback |
| L4 | Feature toggle | Observability gates | Canary/blue‑green | Auto rollback on error budget |
Day 30 goal: reach L2. Day 60 goal: reach solid L3. L4 comes later but foundations are laid.
60‑Day Timeline & KPI Targets #
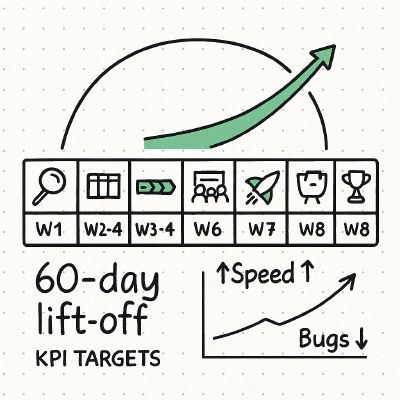
| Week | Focus | Deliverables | Leading KPIs |
|---|---|---|---|
| 1 | Audit & kickoff | Value‑stream map, baseline metrics | Cycle time, deploy freq, WIP snapshot |
| 2 | Kanban + WIP | Live board, team canvas | WIP ≤ 2 × devs |
| 3–4 | CI scaffold | Green builds, failing tests blocked | PR pass‑rate ≥ 70 % |
| 5 | Shape Up betting | 2–3 pitches approved | Pitch quality score |
| 6 | Cycle midpoint | Demo “must‑have” slice | 50 % bets complete |
| 7 | Daily staging deploy | Trunk merged daily | Lead Time ≤ 2 days |
| 8 | First prod daily deploy | Full retrospective | Defect rate ↓ 40 %, NPS ↑ |
Lagging KPIs to track: customer‑visible defects, customer cycle time (request→live), feature adoption (%), and developer satisfaction (quarterly pulse).
Objections—And the Data That Answers Them #
| Objection | Evidence‑Based Rebuttal | Fast Experiment |
|---|---|---|
| “Writing tests slows delivery.” | TDD adds +15–30 % coding time but reduces defect fixing by 40–90 % (IBM, Microsoft). ROI ≥ 4 ×. | Pick one API, run TDD for a week. Compare bug count. |
| “Re‑org mid‑project is risky.” | Start with a non‑critical but revenue‑tied stream. 70 %+ see blocker drop in 2 sprints. | 6‑week pilot squad w/ identical headcount. |
| “Off‑shore DevOps owns infra.” | CI/CD removes drudgery; vendors focus on infra‑as‑code. Costs fell 15 % in 2 JetThoughts cases. | Migrate one repo to GitHub Actions in 3 days. |
| “Backlog is our knowledge base.” | Betting table preserves best ideas; zombie tickets expire automatically. Grooming time ↓ 50 %. | Archive any ticket untouched for 90 days; watch noise drop. |
| “Meetings keep us aligned.” | Async daily updates + weekly demos outperform 14‑person stand‑ups. Teams recovered 4–6 focus hrs/wk. | Convert stand‑up to slack thread for one sprint. Track cycle time. |
Mini‑Case: Fintech Startup in Freefall #
Context
- 35 engineers, 4 silo teams, vendor DevOps.
- Deploys: Monthly → quarterly due to rollback fear.
- P0 on‑call alerts: 7 per month.
Intervention timeline (JetThoughts)
| Day | Event | Metric Shift |
|---|---|---|
| 7 | Kanban + WIP enforced | WIP from 58 → 21 |
| 21 | CI pipeline green | PR pass‑rate 32 % → 78 % |
| 35 | First Shape Up demo | Cycle time 14 d → 8 d |
| 45 | Daily prod deploys start | P0 alerts down to 2/month |
| 60 | 2 squads live, fully autonomous | NPS dev 3.2 → 7.8 |
Financial outcome: CFO calculated 2.6 engineer‑months recaptured per quarter, outpacing JetThoughts fee by 180 %.
Cost–Benefit Snapshot #
| Category | Typical Baseline | Post‑60‑Day Pilot | Annualized Value* |
|---|---|---|---|
| Dev hot‑fix hours | 400 hrs/qtr | 220 hrs/qtr | +$72 k |
| Vendor escalation bills | $6 k/mo | $2.5 k/mo | +$42 k |
| Attrition backfill | 2 engineers/yr | 0–1 | +$60 k |
| Delay‑driven lost revenue | Hard to quantify | 2–4 weeks sooner features | ++ |
| Totals | — | — | >$174 k/yr |
*Assumes blended $75/hr engineer cost. Numbers from aggregate JetThoughts engagements.
Executive Summary #
- Problem → After early traction, engineering slows: silos, vendor bottlenecks, rising defect counts.
- Solution → Five‑move playbook: squadify, Shape Up, WIP limits, TDD, CI/CD.
- Proof → Daily deploys, half cycle time, 40–60 % defect drop, six‑figure capacity gains.
- Timeline → Two weeks to first win, 60 days to new normal.
- Risk Mitigation → Start with one pilot stream; expand only once numbers prove out.
Glossary for Busy Execs #
- Cycle Time — Calendar days from work start to prod deploy. Lower = faster feedback.
- CI/CD — Continuous Integration/Continuous Delivery: automated build, test, deploy.
- Shape Up — 6‑week build + 2‑week cool‑down model from Basecamp.
- WIP Limit — Max items any column/team can hold to cut multitasking.
- Value‑Stream Squad — Cross‑functional team owning an end‑to‑end customer outcome.
Next Step #
If your roadmap is stalling, a 30‑minute call can surface hidden org‑design debt and craft a 60‑day pilot.
Book here → [https://jetthoughts.com/contact-us/ ] We’ll benchmark cycle time, defect velocity, and deploy cadence, then share a customized plan (plus references from founders who’ve made the leap).
JetThoughts — We build teams that build products, faster.